How to measure website performance using Pingdom
This article describes how to use the Pingdom web tool to measure and monitor a website's performance.
Table of Contents
Using Pingdom
To measure your site's performance using Pingdom, follow these steps:
- Use your web browser to go to http://tools.pingdom.com.
- In the text box, type the URL that you want to test.
- Click Settings:
- If you do not want the test results to be viewable by the public, clear the Save test and make it public check box.
- If you want to test the site from a particular location, select the geographic region that you want.
- Click . Pingdom analyzes how long it takes to download the page and each element on the page, and then provides a “waterfall” chart of the entire page load process. Each downloaded resource is represented by a color bar on a timeline.
Interpreting the results
For each item listed in the waterfall chart under File/path, you can hover your mouse pointer over the corresponding color graph. Pingdom shows each download step and the amount of time it took:
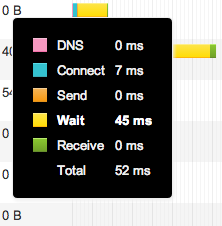
As you can see, each step of the page load process is color coded:
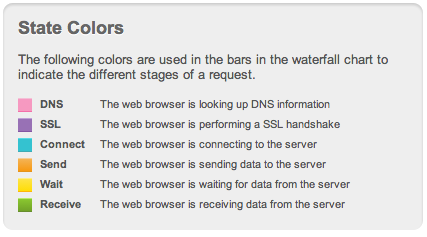
Let's look closer at each of these steps in the page load process:
DNS: This is the amount of time it takes for the browser to identify where the site is hosted. Make sure your site uses a reliable DNS server. For information about setting the name servers for a domain, please see this article.
SSL: If the URL specifies SSL (that is, if the URL begins with https://), this means the browser is exchanging encryption keys with the web server.
Connect: This is the amount of time it takes for the browser to open a connection to the server on port 80 (HTTP) or 443 (HTTPS) before the browser actually sends the request. The server then sends a response when it is ready to accept a request. Using persistent HTTP connections (that is, the Connection: Keep-Alive header) reduces the time for subsequent client requests to the server.
Send: This is the amount of time it takes for the browser to send the request, including the URL, Cache-Control headers, cookies for the domain, and any other headers that the browser wants to send (such as User-Agent).
Wait: This is the most important step, and one that you can control as a webmaster. The wait time is the amount of time for the server to process a request, generate content, and start to send a response. This includes processing .htaccess rules, running PHP code, and accessing databases.
Receive: This the the amount of time it takes to download the requested page after the server starts sending the response.
Total: This is the total amount of time to do all of the above steps.
More Information
For more information about Pingdom, please visit https://www.pingdom.com.
Article Details
- Product: All accounts
- Level: Beginner
Grow Your Web Business
Subscribe to receive weekly cutting edge tips, strategies, and news you need to grow your web business.
No charge. Unsubscribe anytime.
Did you find this article helpful? Then you'll love our support. Experience the A2 Hosting difference today and get a pre-secured, pre-optimized website. Check out our web hosting plans today.